Switchgear manufacturer (name under NDA) · Low-voltage electrical panels · Italy
2 days
to a priced quote, instead of about 10
Quoted by hand. Then not.
3 weeks
UnblockSee the business

See the business
The problem is rarely the chart. It is the data underneath. One data model in your own words, and the ERP stays.
The director asks what the pipeline is worth. Someone opens three files to answer. Sales has one customer list, accounting has another, and the ERP has a third. The monthly report is assembled by hand, and by the time it's ready, half of it is out of date.
This is the normal state of most companies, large and small.
29%
Smaller manufacturers aren't exempt. Before joining the UK's Made Smarter programme, 97% of participating companies already had some digital technology. They had adopted it piece by piece, and the systems needed integrating (Ipsos for DBT, 2025). Data and systems integration became the programme's most supported category, ahead of new machines.
MIT's Center for Information Systems Research studied 721 companies. Those with fragmented systems — what the researchers call "silos and spaghetti" — grew revenue 12.8 percentage points below their industry average, with margins 10.6 points lower. Companies with their own integrated internal platform grew 12.4 points above average (MIT CISR, 2025).
That is correlation, not proof of cause. But it is a large gap, and it points the same way as everything else.
A BI tool draws charts from the data it receives. When the CRM says one thing and the ERP another, the dashboard shows one of them, and the meeting turns into an argument about which number is right. The problem is rarely the chart. It is the data underneath.
Research on data-driven decision-making found productivity 5 to 6% higher in companies that decide on data (Brynjolfsson, Hitt and Kim). The effect appeared only where decisions actually changed. A dashboard nobody looks at does nothing.
What works is less glamorous.
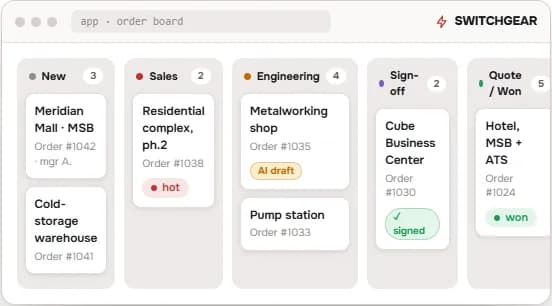
For the panel maker in Quoted by hand. Then not., the director had no view of the pipeline before. Now there is one screen: revenue by month, the funnel with amounts at each stage, average deal size, conversion, time to quote, top managers by volume, and a list of orders that have been in one stage for more than 14 days, each one clickable.
The director sees the business without asking anyone what's in it. The ERP stayed.
Cost calculator
Write down the five numbers you need every Monday. For each one, note where it comes from today, who assembles it and how long it takes. That list is the specification for the first screen.
Related: Your business runs on a spreadsheet · Build or buy? A checklist for mid-sized companies
Switchgear manufacturer (name under NDA) · Low-voltage electrical panels · Italy
2 days
to a priced quote, instead of about 10
3 weeks
Four systems. None of them agree.
Thirty minutes. You describe the pain and the result you want. We ask questions. If we can help, you get one email with what we found, what we'd build and what it costs. If we can't, we'll say so.